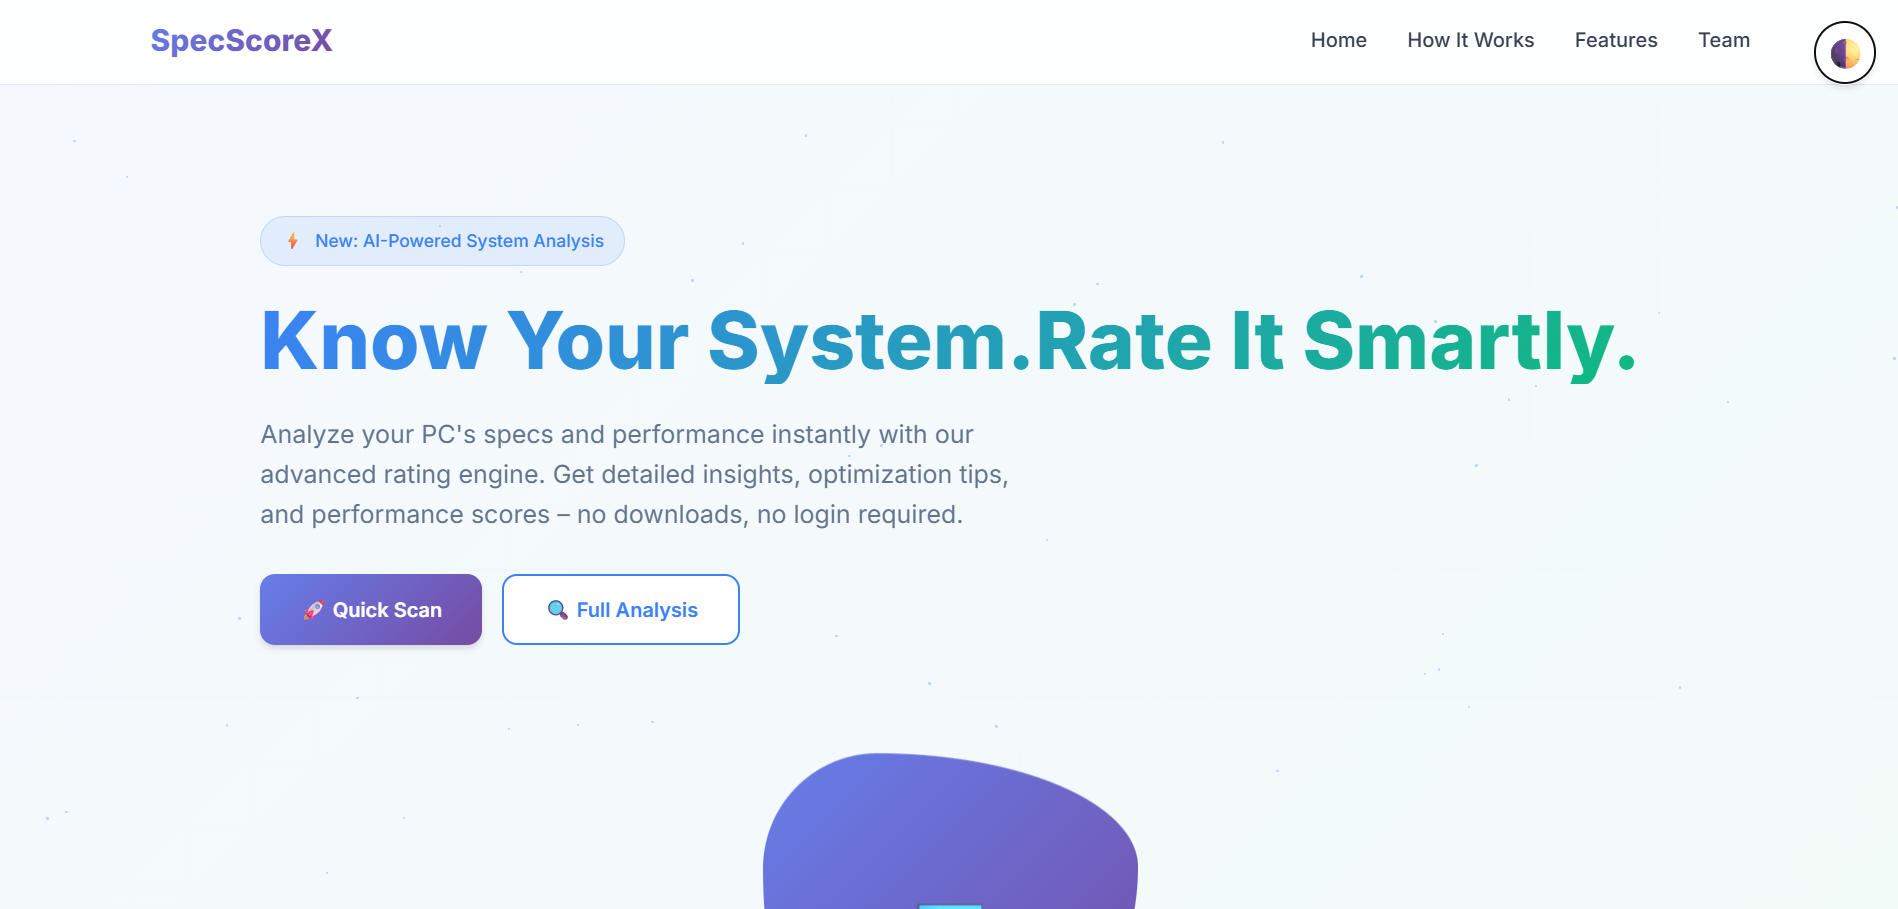
SpecScoreX is a system-assessment project built with Python and Flask. It collects information about a computer, processes the data, and presents a consolidated score with supporting details in a web dashboard. Pandas is used to work with the collected values, while HTML, CSS, and JavaScript provide the interface. The project also explores a lightweight local agent and automatically generated reports. The aim is to make technical system information easier to understand, not to suggest that a single score can describe every aspect of real-world computer performance.
The problem
A computer's specifications do not always tell a user how the machine is likely to feel in everyday use. Processor, memory, storage, and other system details are useful individually, but comparing them manually can be confusing, especially for someone who is not familiar with hardware terminology.
The solution
I developed a Python-based assessment workflow that collects system information, processes the values, and turns them into a more readable performance summary. Flask provides the backend endpoints, Pandas helps organise the data, and a browser-based dashboard presents the results. I also explored a lightweight agent for collecting information from the local machine and a report-generation flow.
What it does
- Collect system and hardware information
- Generate a consolidated assessment score
- Present collected details through an analytics dashboard
- Use a lightweight agent to gather local system information
- Generate reports from the assessment
- Display hardware details in a more approachable format
What was hard
Collecting information from a machine and presenting it clearly involves more than displaying a list of values. The data needs to be organised into a consistent structure, and the interface should not become difficult to use when some information is missing or unavailable. I focused on separating collection and processing from presentation so the dashboard could show the assessment and its supporting details in a readable way.
Results
SpecScoreX brings system information and its interpretation together in one interface. Rather than asking users to make sense of raw hardware values on their own, it presents the collected details in a structured overview that can be used for comparison and further inspection.